Overview:
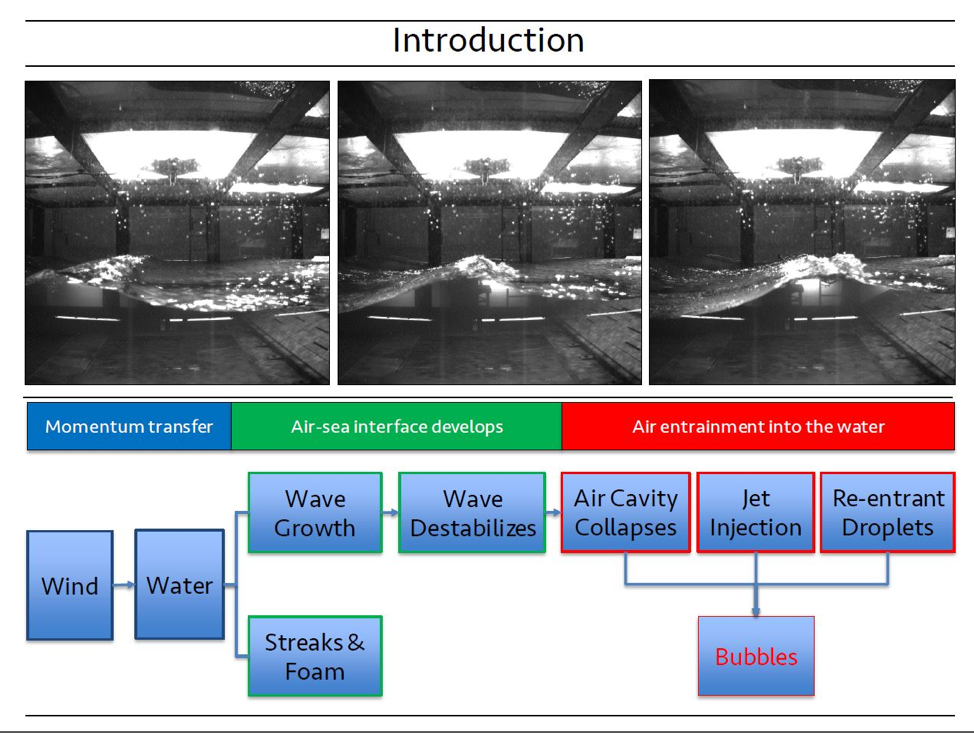
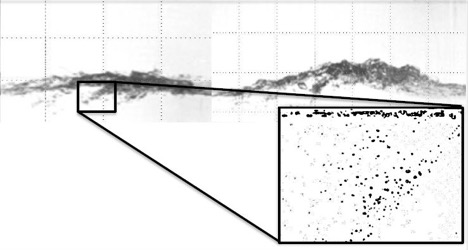
Gas exchange is a key part of the biogeochemical cycle of many climatically important gases, such as CO2, N2O, and DMS. Additionally, accurate estimates of gas exchange are necessary to calculate rates of biological production from O2 data, as is being done increasingly with data from floats, gliders, and other autonomous platforms. While there has been much improvement in gas exchange parameterizations, several large uncertainties remain. One is the role of bubbles, which in many conditions may represent a significant portion of the overall gas exchange flux. Second, gas exchange at high wind speeds is not well known, because ships usually cannot sample high wind speed conditions. To that end, in this project we are using noble gases in a controlled environment, namely the SUSTAIN wind-wave tank, in order to better characterize gas exchange at high wind speeds. We are focusing on characterizing the bubble flux and linking the gas exchange flux with the observed bubble size spectra by explicitly imaging bubbles as well as by continuously measuring a suite of noble gases, enabling us to separate bubble from diffusive fluxes.
Measurements
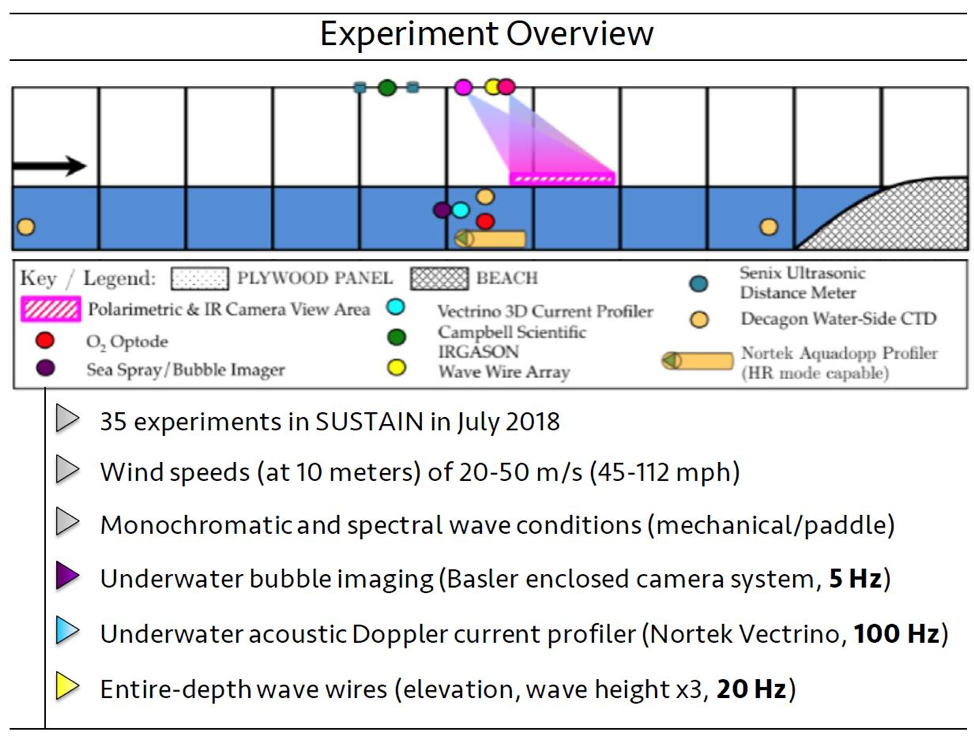
We performed the second year’s set of experiments in July 2018. Fig. 1 shows selected photos from the experiments. In particular, Stanley and four of her Wellesley undergraduate students spent 10 days at the University of Miami’s SUSTAN tank, where they set up two mass spectrometers – a noble gas mass spectrometer that measures Ne, Ar, Kr and Xe continuously as well as an equilibrator inlet mass spectrometer that measures O2 and Ar. Additionally, we used an optode to continuously measure oxygen within the tank and collected 53 discrete samples for noble gas analysis. Those samples will have higher precision, include helium (which the continuous, portable mass spec does not analyze), and provide concentrations (rather than ratios). The Miami group, led by Brian Haus, used a shadowgraph technique to image the bubbles, a polarimetric camera to make short wave measurements to mm scale to resolve the full wave spectrum and to calculate the sea surface slope spectrum over short (<1 s) time scales, an infrared camera to measure the water surface temperature and to identify micro-breaking events, a Vectrino acoustic current meter to make fine scale velocity and turbulence measurements, an Aquadopp acoustic current meter was used to profile velocities over two cm bins in the vertical and to calculate turbulence from structure function estimates, an IRGASON sonic anemometer to measure wind velocity, wind stress, heat flux, water vapor flux and CO2 flux using direct covariance measurements, 5 Senix ultrasonic distance meters to measure directional wave spectrum on upwind/wave side of bubble imager, 4 capacitance wave array to measure directional wave spectrum down-wind/wave from the bubble imager and 4 CTDs.
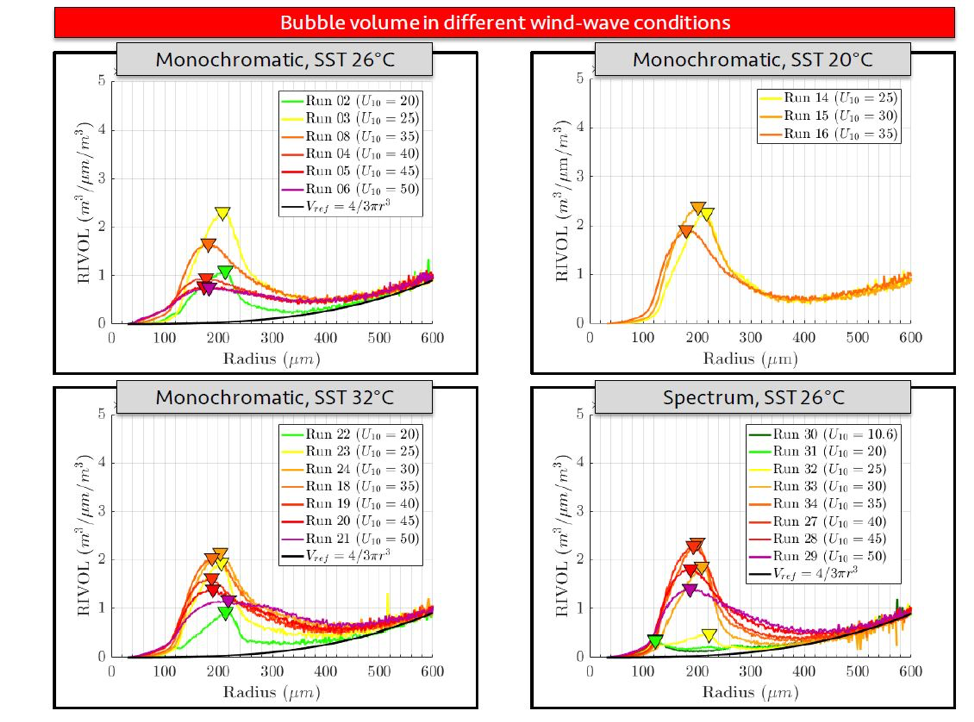
We performed 35 experiments, covering a range of wind speeds from 20 to 50 m s-1 (in 5 ms s-1 intervals), and at water temperatures of 20, 26, and 32 deg C in order to examine unstable, neutral, and stable conditions. Most of the experiments were with monochromatic long-crested waves but we also did one set of experiments (at 26 deg C only) with short-crested JONSWAP wave spectra with variable wave height in order to see how the gas exchange and bubbles changed with different wave types. Additionally, we partially equilibrated the water between experiments and collected many of the types of data during those equilibration periods as well.
Additionally, we analyzed much of the data from the 14 experiments we performed in year 1 of this project. All the continuous noble gas data was processed and corrected for variations in temperature of the room, drift in mass spectrometer. Similarly, all necessary corrections were applied to the continuous oxygen data. The discrete noble gas samples from year 1 were analyzed in a lab at Woods Hole Oceanographic Institution. The bubble shadowgraph data from year 1 were processes and bubble volumes and sizes calculated. Data on noble gases and oxygen was started to be examined on an experiment by experiment basis in order to start deducing the effect of bubbles and wind and wave type on gas exchange
Temporal and spatial scaling of dissipation under non-breaking waves.
National Science Foundation Award #1435159,
Collaborative Research: Brian K. Haus (UM/Rosenstiel School) and Darek Bogucki (Texas A&M, Corpus Crisit)
The overarching goal of this project was to address a significant knowledge gap regarding the turbulent dissipation of non-breaking surface waves. To accomplish this, a comprehensive study in the SUrge-STructure-Atmosphere-INteraction (SUSTAIN) wind-wave laboratory at the University of Miami is planned. A combination of established measurements ( shear probes, PIV and hot-film anemometry) and new technologies (Optical Turbulence Sensor (OTS)) has been used carry out the measurement of energy and temperature dissipation under grid-generated turbulence, breaking and non- breaking waves. Based on these measurements we have developed a combined experimental/theoretical approach using imaging techniques to calculate the energy and temperature dissipation under non-breaking waves. The theoretical approach permits also to calculate energy and temperature dissipation under non breaking internal waves.
Infrared imaging development in ASIST
Short range infrared (IR) observations of ocean surface reveal complicated spatially varying and evolving structures. Here we present an approach to use spatially correlated time-series IR images, over a time scale of one tenth of a second, of the water surface to derive underlying surface velocity and turbulence fields. The approach here was tested in a laboratory using grid-generated turbulence and a heater assembly. The technique was compared with in situ measurements to validate our IR derived remote measurements. A velocity error analysis demonstrated that for flat surfaces the IR can provide the flow velocities to within at least 10% of the actual value for a wide range of conditions. The IR measured turbulent kinetic energy (TKE) dissipation rates were consistent with in situ measured dissipation using a microstructure profiler (VMP). We used measurements of the gradient of the velocity field to calculate TKE dissipation rates at the surface. Based on theoretical and experimental considerations, we have proposed two models of IR TKE dissipation rate retrievals and designed an approach for oceanic field IR applications.
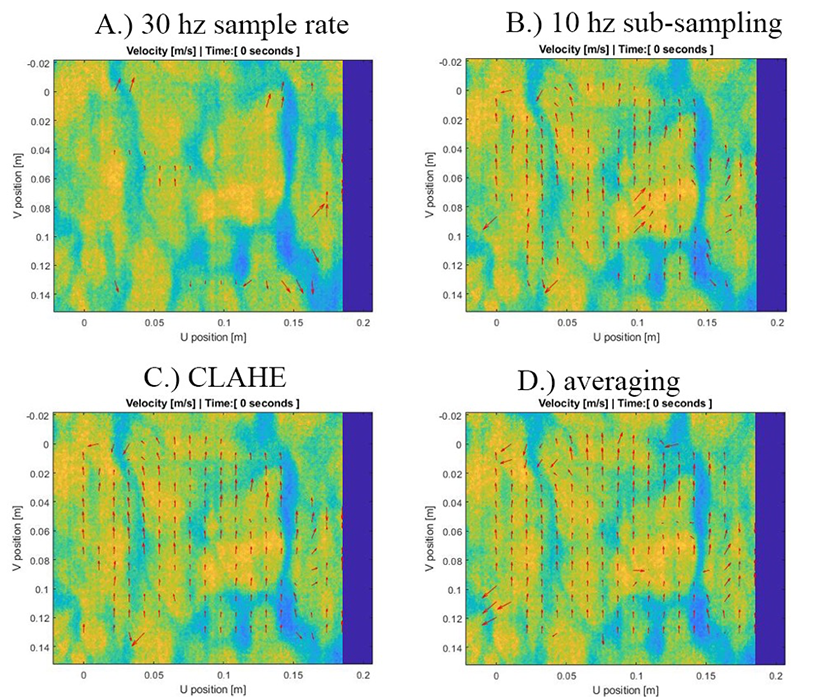
The FIV retrieved velocity vector field after successive application of the following operations: A.) raw image, B.) data was sub-sampled at 10 hz. C.) CLAHE was applied, D.) the vector fields were sequentiallaveraged in groups of three.
Wave-induced turbulence observations in SUSTAIN
Our experimental effort consisted of: turbulence sensor calibration (Optical Turbulence Sensor (OTS), shear probes, and fast thermistor) and collecting data under non-breaking waves. By analyzing experimental data, we have developed a theoretical method to calculate the energy dissipation. The comparison of measured data with theory is consistent with wide range of wave slopes corresponding to turbulent dissipation over 3 orders in magnitude. Here we have determined the nature of turbulent flow associated with oceanic nonbreaking waves, which are on average much more prevalent than breaking waves in most wind conditions. We found this flow to be characterized by a low turbulence microscale Reynolds number of 30<Re𝜆 <100. We observed that the turbulent kinetic energy dissipation rate associated with nonbreaking waves 𝜖, ranged to 3 · 10−4 W/kg for a wave amplitude 50 cm. The 𝜖, under nonbreaking waves, was consistent with 𝜖 = 2𝜈T(Si𝑗)2; Sij is the large-scale (energy-containing scales) wave-induced mean flow stress tensor. The turbulent Reynolds stress associated with nonbreaking waves was consistent with experimental data when parameterized by an amplitude independent constant turbulent eddy viscosity, 10 times larger than the molecular value. Given that nonbreaking waves typically cover a much larger fraction of the ocean surface (90–100%) than breaking waves, this result shows that their contribution to wave dissipation can be significant.
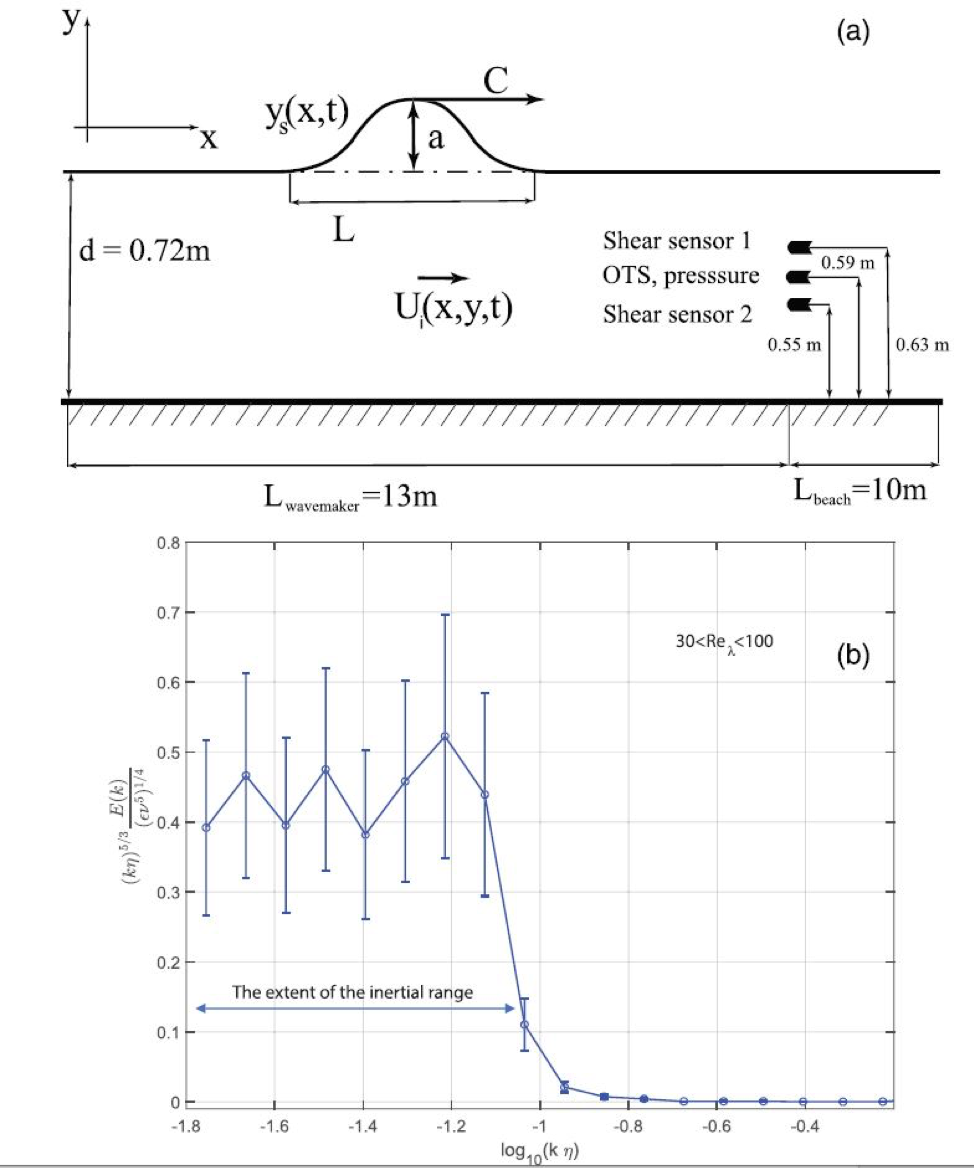
(a) Schematic depiction of the experimental setup side view. The Ui(x, y, t) denotes flow components under the wave. The location of the in-water sensors and their depths in undisturbed water are shown. (b) The VMP measured shear spectra displayed as the compensated nondimensional energy spectra k5/3E(k). The wavenumber k is nondimensionalized by the Kolmogorov length scale 𝜂. The microscale Reynolds number, Re𝜆, for the collected spectra was 30 < Re𝜆 < 100. The error bar represents 1 standard deviation within the sample.
Related journal articles:
Bogucki, D. J., Haus, B. K., Barzegar, M., Shao, M., & Domaradzki, J. A. (2020). On the nature of the turbulent energy dissipation beneath nonbreaking waves. Geophysical Research Letters, 47, e2020GL090138. https://doi.org/ 10.1029/2020GL090138.
Metoyer, S. , M. Barzegar, D. Bogucki, B. K. Haus and M. Shao, Measurements of Small-scale surface velocity and turbulent kinetic energy dissipation rates using infrared imaging, J. Atmos. Oce. Tech. (in press)

